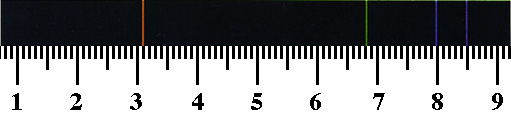
Your spectroscope contains a scale with arbitrary values on it. To determine what wavelengths these values correspond to we must look at an element whose spectrum we already know. We will use the hydrogen spectrum for this purpose. By looking at a hydrogen discharge tube through your spectroscope, identify the location of the four lines of the Balmer series on your scale.
The lines appear at the wavelengths 410.1, 434.0, 486.1 and 656.3 nm. Prepare a calibration curve by plotting a graph of scale reading (y-axis) vs. wavelength of line (x-axis). Be sure you assigned the correct wavelength to each line. If you get stuck think about the color each line should be. If you plot it correctly you should get a straight line.
When we look at other elements we will also record the scale reading of the lines we observe. Using our calibration curve we can convert these readings into wavelengths.