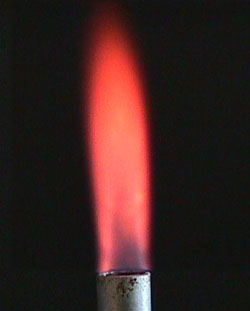
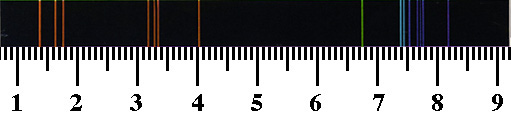
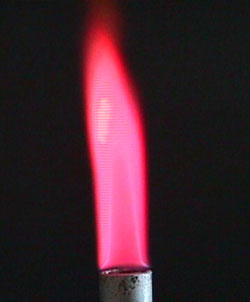
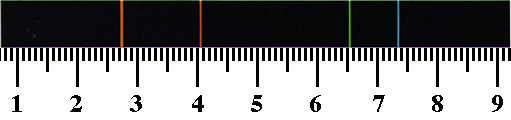
You now have a graph of scale reading vs. actual wavelength. Use this graph to determine the lines in the spectra of each of the following elements. Click on the entries in the table below to view the flame test and the element's spectrum. Make sure to record the location of the lines and the color of the flame test or discharge tube.