Spectroscopy - The Hydrogen Atom
The figure below is an energy level diagram for a hydrogen atom. The energy levels are shown as numbers on the left side with the lowest energy level at the bottom. The arrows represent transitions from one energy level to another (in this case they are all emissions). Each group of transitions is given the name of the scientist who identified their origin.
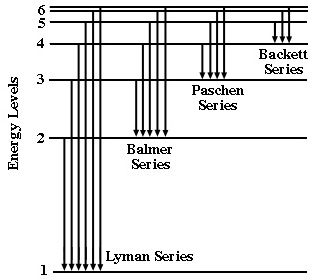
The relative length of the arrows tells us the relative amount of energy released when the atom undergoes this transition. The longer the arrow, the more energy released, and the shorter the wavelength of the light emitted. The Balmer series releases light in the visible region of the electromagnetic spectrum. The Lyman series, with longer arrows, requires the higher energy of the UV region. The Paschen and Brackett series, with shorter arrows require the lower energy of the IR region.
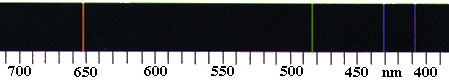
Below is the visible emission spectrum of hydrogen. Note the four lines corresponding to the four arrows of the Balmer series (in order from left to right).
This completes the background material. Proceed to the practicalities section.


